Timelines Revisited
A Design Space and
Matthew Brehmer · Microsoft Research · @mattbrehmer
in collaboration with IEEE VIS 2017 · 10-03-2017 · timelinesrevisited.github.io
Thank you.
Throughout history, people have recorded events on timelines;
A Timeline Design Space
representation
scale
layout
Today I'm going to introduce you to a structured way to think about this design space.
CLICK : and I'm glad to be speaking in the 'Time and Space' session, because I'll begin with a primer on SPATIAL metaphors for time.
Image:
Perhaps the most common representation for time is linear: the time as an arrow metaphor.
Chart of Biography published over 250 years ago,
Image:
Here time is mapped from left to right (the years are BCE here); you can see the lifespans of a number historical figures, offset vertically to avoid overdrawing.
Image:
Radial representations are especially effective when presenting and highlighting natural cycles and events that repeat,
Image:
But of course time is both linear AND cyclic, like this staircase, something that repeats and yet coils upwards or forwards.
Image:
Yet another representation for time is the grid, often manifested as a calendar.
See "How to make history dates stick " by Mark Twain in Harper's Monthly Magazine (1914).
The last class of representation that I'll speak about is not restrained by a specific shape.
Common visual representations of time :
So I just gave you a brief and certainly incomplete primer of different spatial metaphors for time,
What is a Timeline For?
And that is, what is a timeline for?
What happened when?
In what sequence did the events occur?
How long did the events last?
How long between event A B
Did A B
When did A B C
Basically, a timeline communicates to the viewer "WHAT HAPPENED WHEN?".
CLICK : But if we unpack this question, a timeline can answer a number of more detailed questions, like:
The Careers of U.S. Open Golf Champions
Dustin Johnson ; R: Jim Furyk
To illustrate these questions and the effects of different time scales, I'm going to talk about golf.
The Careers of U.S. Open Golf Champions
Data source: Wikipedia . This data is also featured in this demo video .
MAX : What you're seeing here are two timelines, Furyk's is on top, Johnson's on the bottom, indicating the results of every U.S. Open appearance in their respective careers.
NEXT : You can see that Furyk has appeared at the U.S. Open for longer than Johnson, and that they both have only one victory to date under their belt.
NEXT : In comparison, golf legend Ben Hogan appeared many times over the course of 4 decades, and he won an impressive four times during a six year span in the late 1940s / early 1950s.
NEXT : Johnson and Furyk never played with Hogan, they were born at different times, and it's a bit unfair to compare a mid-career golfer and an early-career golfer to a legend like Hogan.
NEXT : But by changing the scale to one that is relative to their births, we can see if Johnson or Furyk are on track to follow in Hogan's footsteps.
NEXT : Or we can remove relative chronology altogether and keep just the sequence of their U.S. Open appearances, where we learn that, coincidentally, all 3 golfers won in their 9th appearance.
NEXT : And finally I can introduce you to another legend, Jack Nicklaus, who appeared more than 40 times, and his 4 victories were more spaced out than Hogan's.
A Timeline Design Space
So, now that I've shown you different representations and time scales, I want to summarize our design space.
A Timeline Design Space
5 representations:
5 scales:
4 layouts:
Our timeline design space has
CLICK : Five representions, NEXT : five scales, NEXT : and third dimension which we call "Layout", or how to draw one or more timelines within a page or display:
The Careers of U.S. Open Golf Champions
1 / 5 representations:
3 / 5 scales:
1 / 4 layouts:
As a point of reference in terms of coverage of the design space, the golf demo I just gave spanned several scales while keeping representation and layout constant.
Our process: Phase 1
Collect and categorize 145
Sources included Cartographies of Time Visualization of Time-Oriented Data et al. ), Making Timelines
So how did we come up with this design space? Well,
CLICK : First, we collected and categorized 145 timelines and timeline visualization tools from various sources, and out of that came the dimensions of the design space.
Our process: Phase 2
Validate with 118 263
Sources included visual.ly , the Kantar IIB Showcase , massvis.mit.edu , ...
Implement points in the design space with 28
Survey data and dataset index can be found at timelinesrevisited.github.io
CLICK : Next, we verified that the design space could be used to label 118 additional timelines that we collected from different sources.
CLICK : We also implemented points in the design space with 28 event datasets, which varied in a number of ways, such as the number of events, the temporal extent of the data, or the rate of event co-ocurrence.
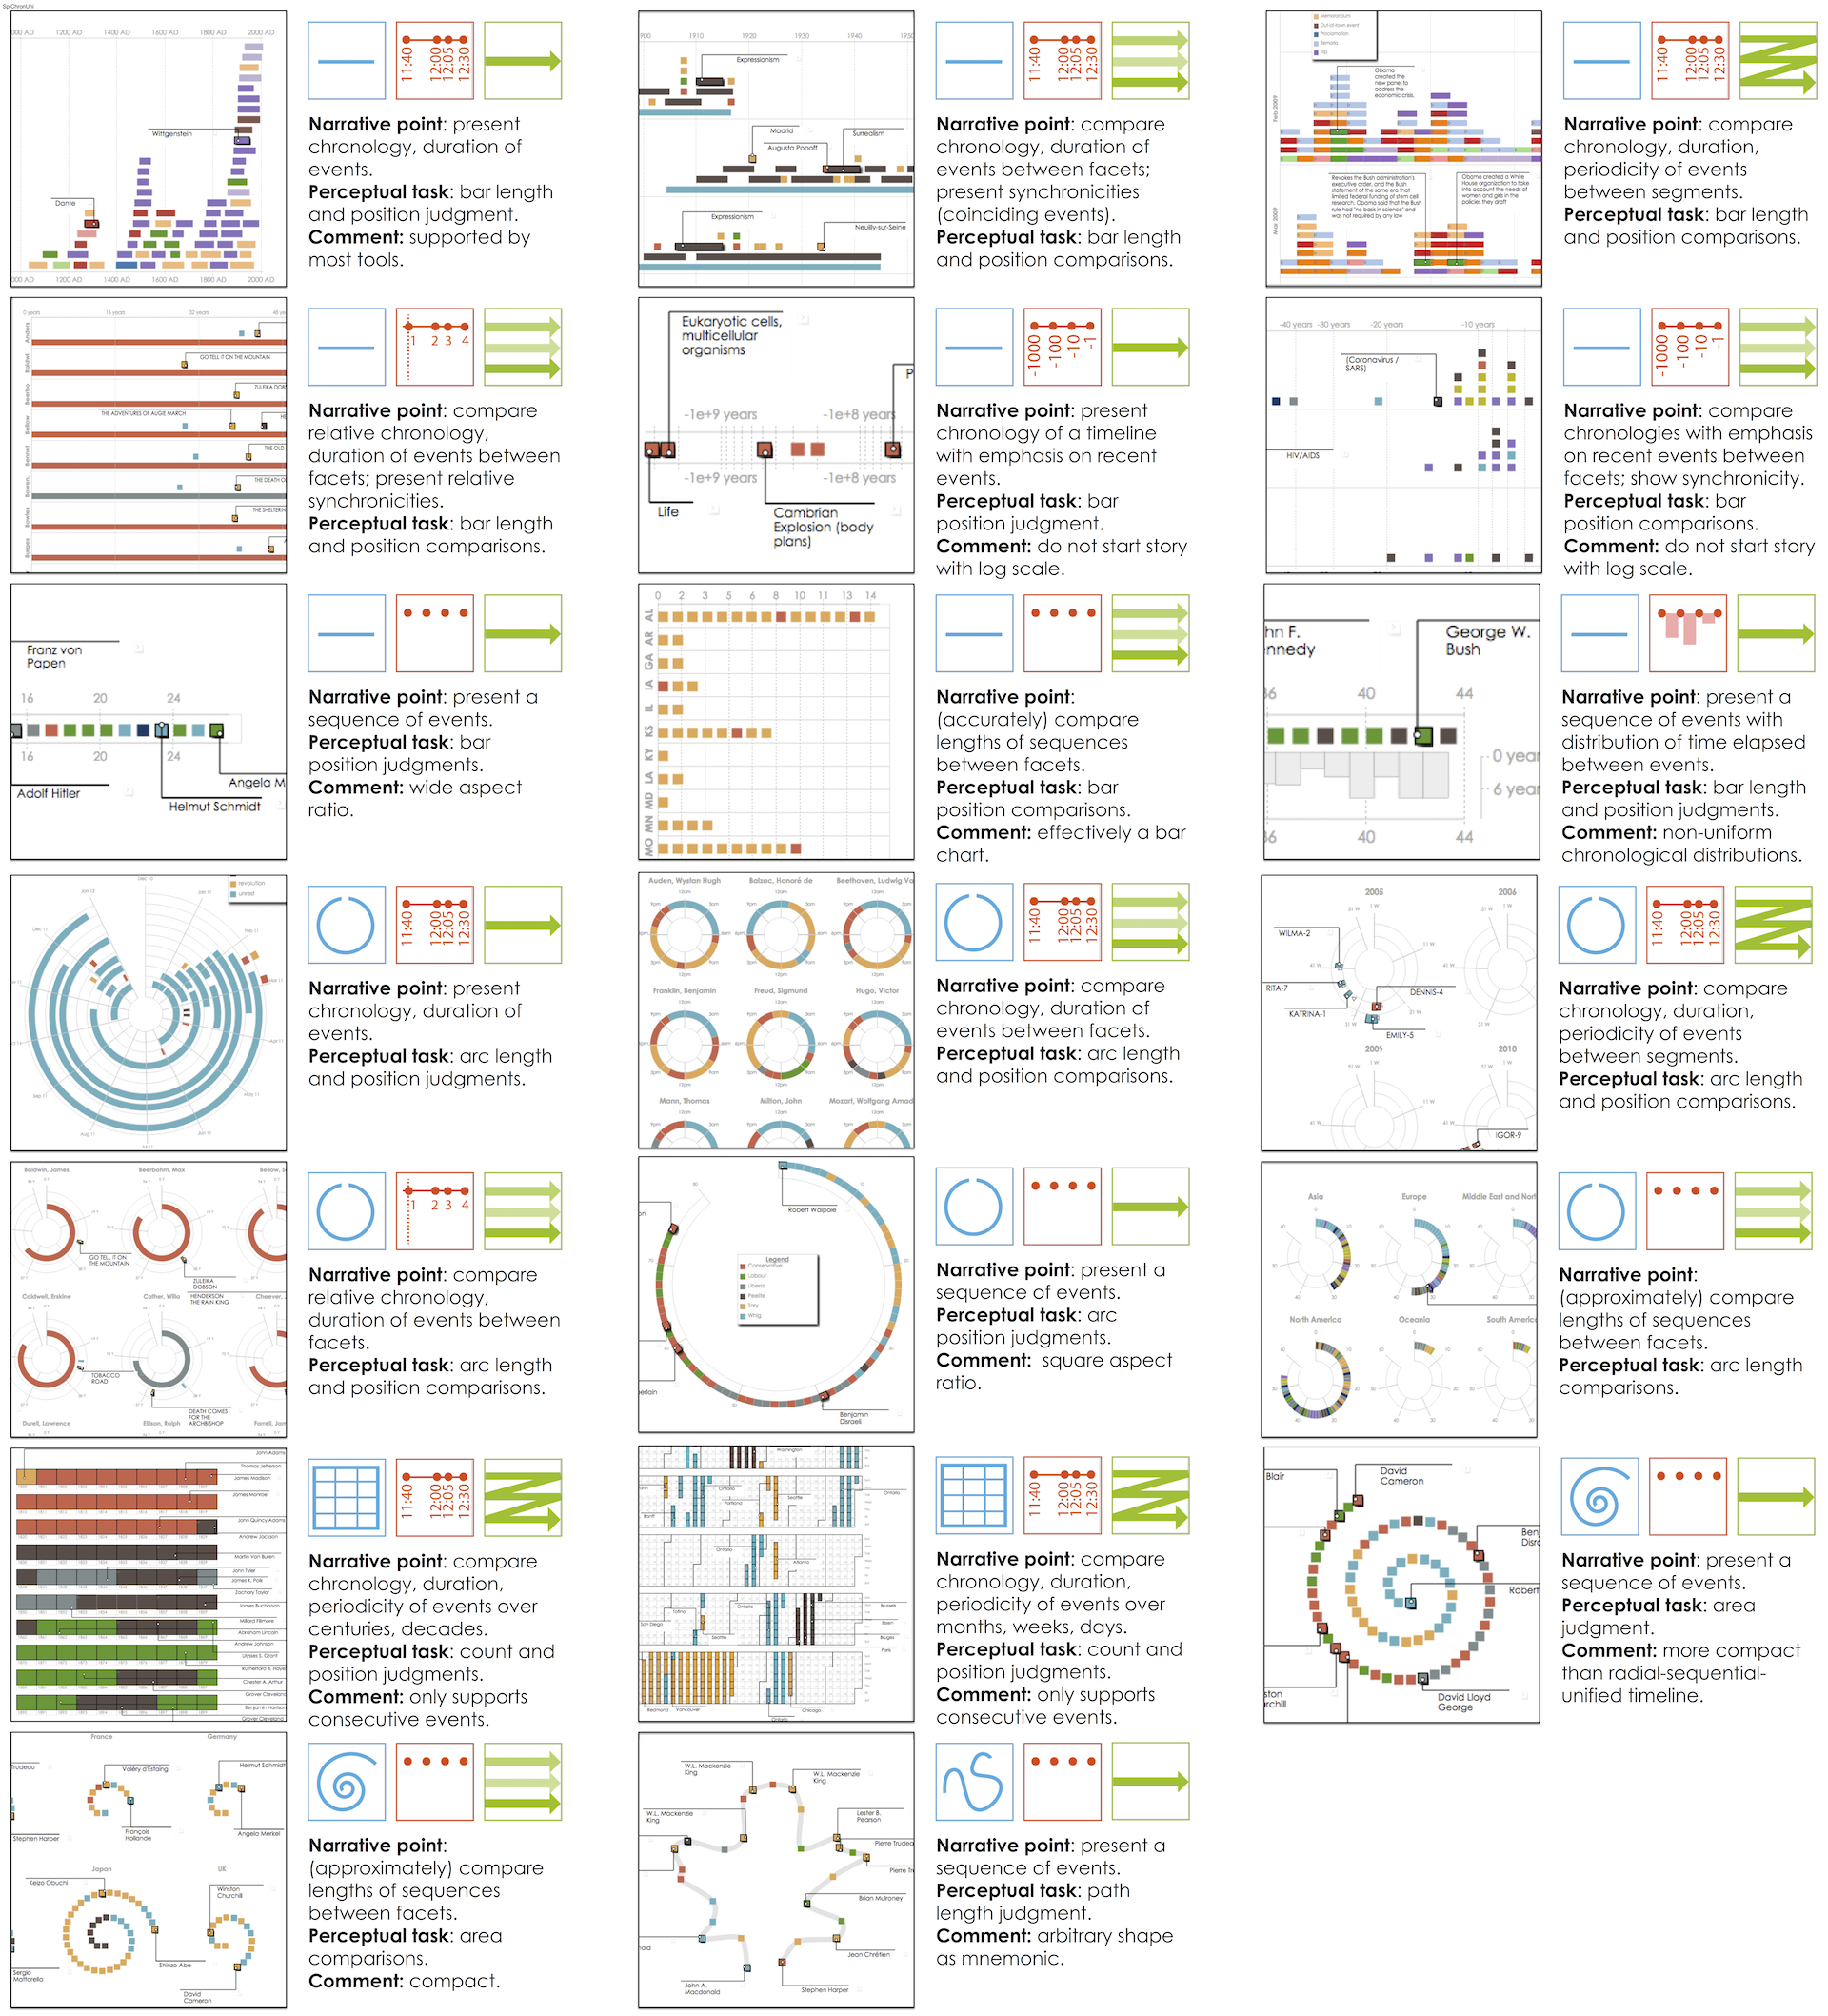
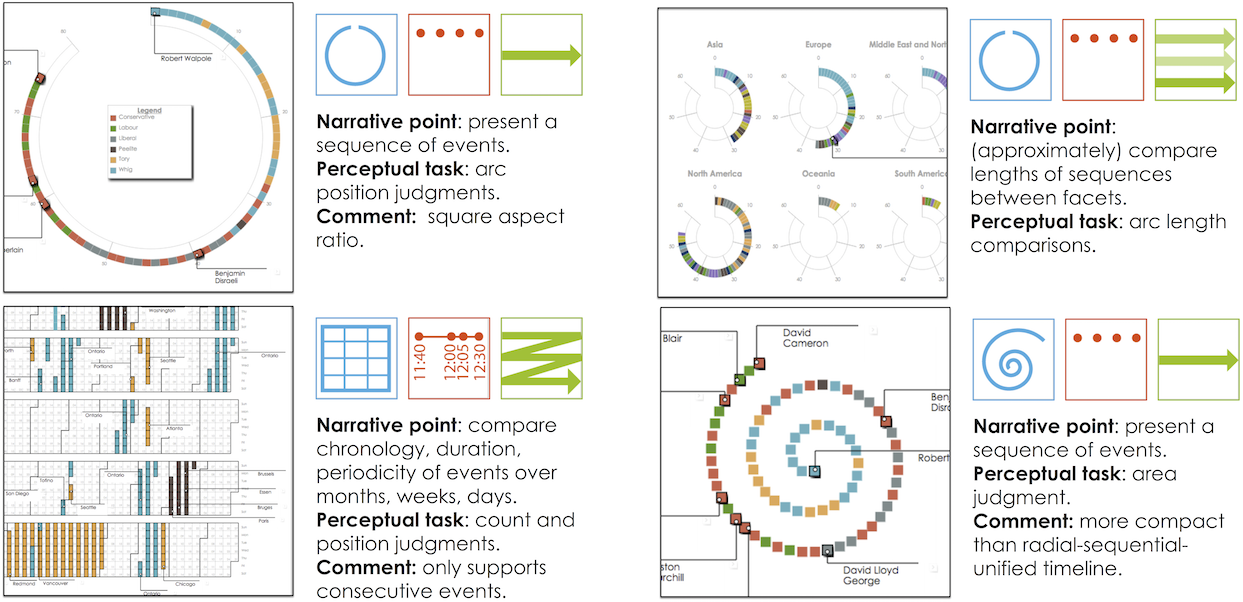
20 purposeful , interpretable , & generalizable timelinesrevisited.github.io
And this process of categorization and implementation also led us to identify 20 viable points in the design space,
Purposeful in terms of their communicative intent, interpretable in terms of which perceptual task the viewer is expected to make, and generalizable across a range of timeline datasets.
ZOOM : This thumbnail gallery from our paper acts as a visual index for these 20 designs, and if you go to timelinesrevisited.github.io,
You can see each of these example designs in detail along with a description of what narrative or communicative intent they serve.
Expressive Storytelling With Timelines
Choice of representations and time scales
Support for chronological or non-chronological narratives
So now that we have all of these design choices, how do we use these design choices to tell stories with timelines?
CLICK : In other words, how do combine different points in this design space?
CLICK : Existing tools also tend towards a chronological narrative: either the whole timeline is shown up front, so readers are likely to begin at the start of the timeline, or events are revealed in chronological order.
The daily routines of famous creative people
Inspired by infographics by Podio and info we trust ; data source: Daily Rituals: How Artists Work Mason Currey (2013)
As a second example that ties all of this together, I'm going to present a story about the daily routines of famous creative people.
MAX : What you see here is a set of radial timelines depicting a typical 24 hours in the lives of 26 writers, artists, composers, and the like.
NEXT : A good starting point is to ask: when do creative people create? Are people similar in this regard?
NEXT : We can also ask about the relationship between sleep and creativity: how much? how often? and when do creative people sleep?
NEXT : This chronological scale isn't the best way to convey the number or heterogeneity of activities, so let's transition to a sequential scale.
NEXT : To determine who varied the most and least, a linear representation is perhaps best, where we can easily see that Darwin has the most varied day of all the people in this dataset,
NEXT : Finally, we can restore chronology to compare these timelines just by scanning up and down, to spot synchronocities like who tends to work or sleep at the same time.
Summary: The Timeline Design Space
Different combinations of timeline representation and scale
I want to finish by reiterating that despite the apparent simplicity of the question of "what happened when?",
Summary: Storytelling Considerations
Use animated transitions, highlighting, and annotation
Consider more than one point in the design space.
...and this design space grows even richer when we introduce dynamic storytelling elements like the incremental reveal, selective annotation and highlighting,
NEXT : and animated transitions between points in the design space.
Timelines Revisited . . . Revisited: Epilogue
And before I pause for questions, a brief epilogue.
First, we developed and released Timeline Storyteller,
timelinestoryteller .com Choice of representation, scale, layout, & narrative structure,
Initially released as open-source web application ,
Featured at OpenVisConf 2017 ,
Now available as free add-on for Microsoft Power BI ,
Featured in the 2017 Data Insights Summit keynote ,
This tool, which you can use now at timelinestoryteller.com, realizes our design space and our proposed considersations for storytelling.
Thanks Bongshin Lee, Benjamin Bach, +
Microsoft Research , HCI@MSR ,
UBC InfoVis Group , the Timeline Consortium ,
Microsoft Power BI , & the MSFT Data Journalism Program .
Both this paper and Timeline Storyteller wouldn't have been possible without the help of my coauthors and colleagues at Microsoft and beyond.


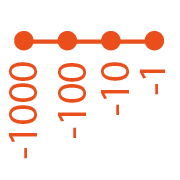


 Image: Joseph Priestley (1765)
 Image: Joseph Priestley (1765)
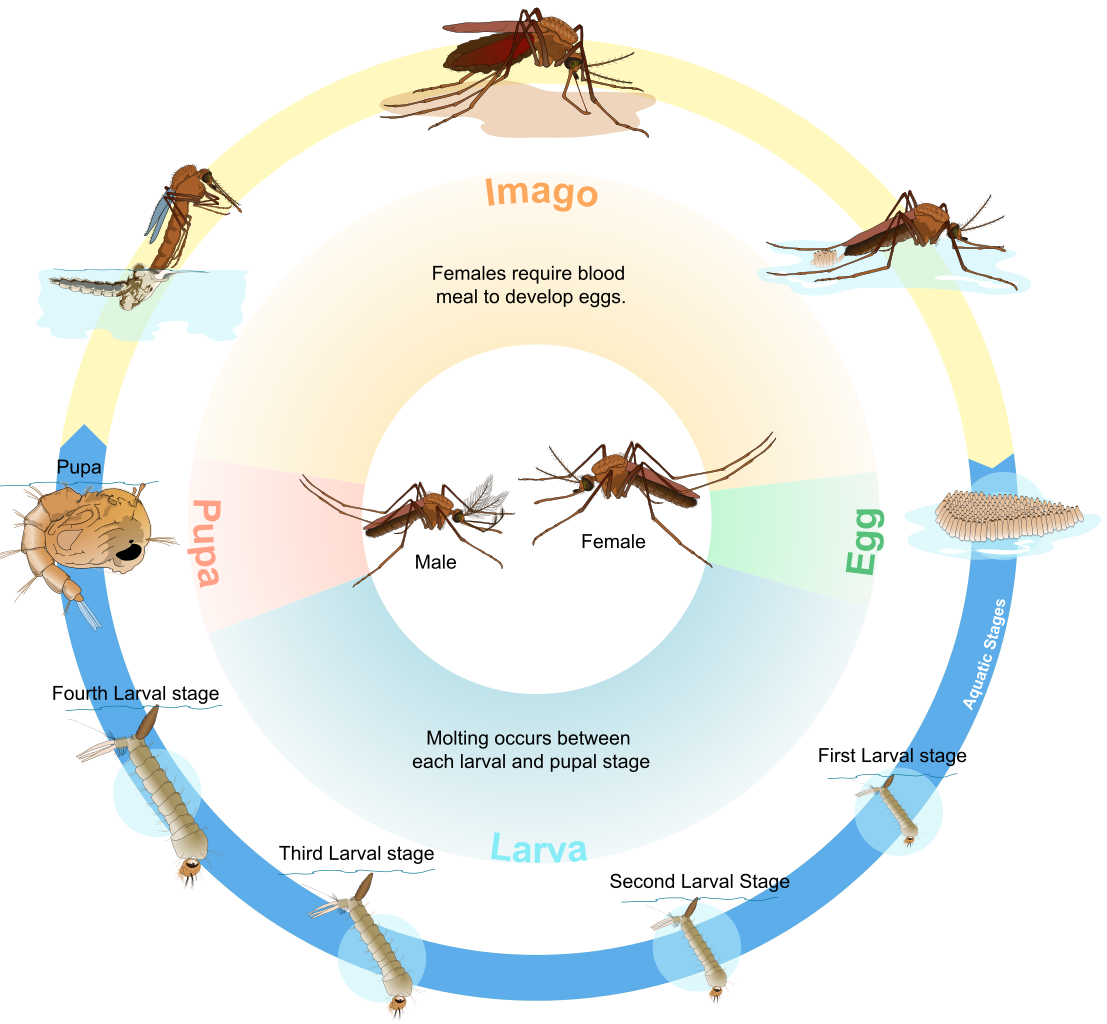 Image: LadyofHats (Wikimedia Commons)
 See "How to make history dates stick" by Mark Twain in Harper's Monthly Magazine (1914).

 Wikimedia Commons; L: Dustin Johnson; R: Jim Furyk
.jpg)